Tuesday, October 31, 2017

Signal processing: FFT with different level of noise

When we do FFT to the signal to find the frequency content, the noise have an effect of getting the correct frequency. Let’s do a test this week to see what are the effects if we add in different level of noise to a signal. You can find all the code at Qingkai's Github
import numpy as np
from scipy import fft, arange
import matplotlib.pyplot as plt
from scipy import signal
%matplotlib inline
plt.style.use('seaborn-poster')
def plotSpectrum(t, y,Fs, title = None):
    """
    Function to plot the time domain and frequency domain signal
    """
    n = len(y) # length of the signal
    k = arange(n)
    T = n/Fs
    frq = k/T # two sides frequency range
    frq = frq[range(n/2)] # one side frequency range

    Y = fft(y)/n # fft computing and normalization
    Y = Y[range(n/2)]    
    
    # plot time domain and frequency domain signal
    plt.subplot(2,1,1)
    plt.plot(t,y)
    plt.xlabel('Time')
    plt.ylabel('Amplitude')
    if title:
        plt.title(title)
    plt.subplot(2,1,2)
    plt.stem(frq,abs(Y),'r')
    plt.xlabel('Freq (Hz)')
    plt.ylabel('|Y(freq)|')
    plt.tight_layout()
    plt.show()
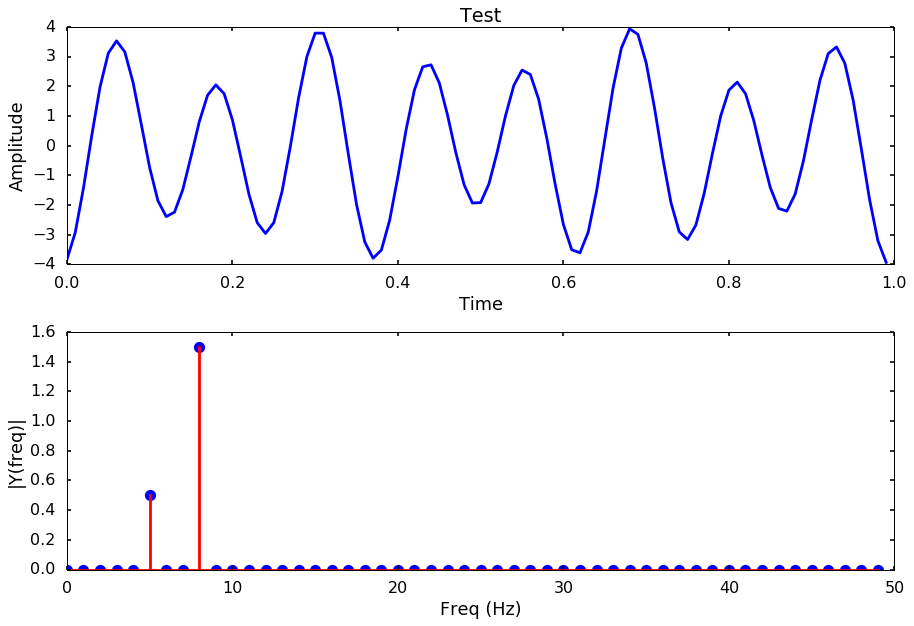
Let’s first generate a signal with two frequencies in the signal, 5 Hz and 8 Hz.
Fs = 100.0  # sampling rate
Ts = 1.0/Fs # sampling interval
t = arange(0,1,Ts) # time vector
ff_1 = 5   # frequency of the signal
ff_2 = 8
# create the signal
y = np.sin(2*np.pi*ff_1*t + 5) + 3 * np.sin(2*np.pi*ff_2*t + 5)

plotSpectrum(t, y,Fs, title = 'Test')
png

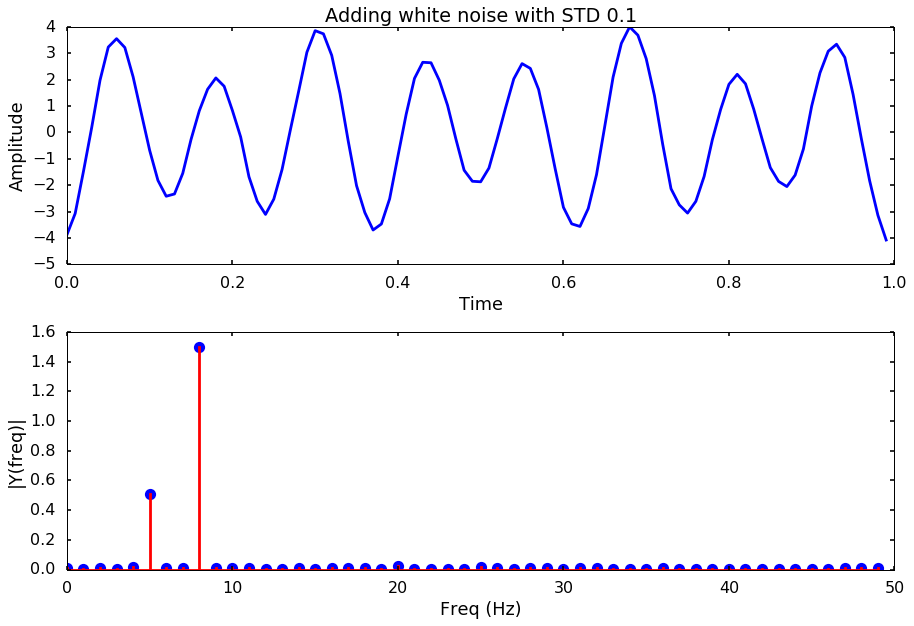
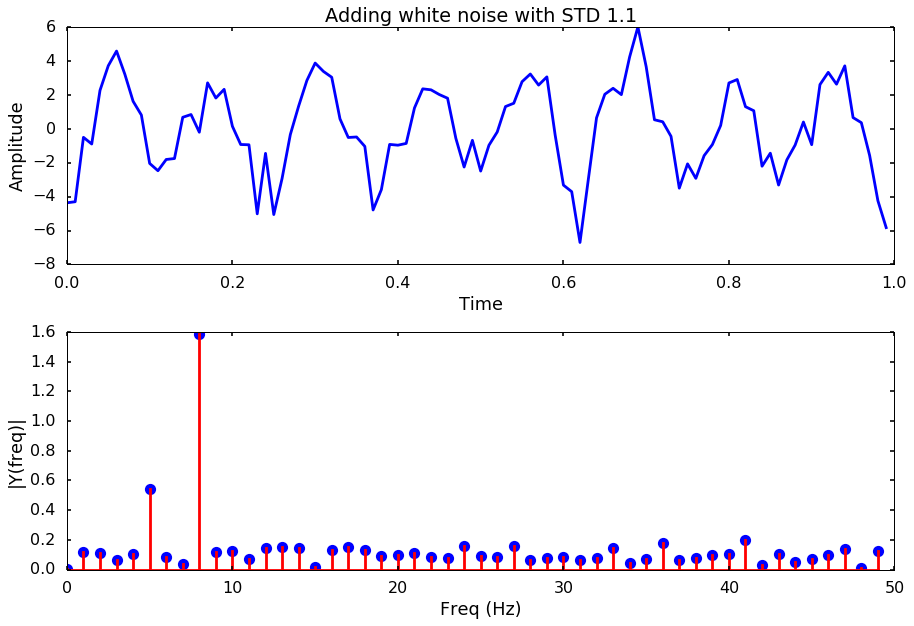
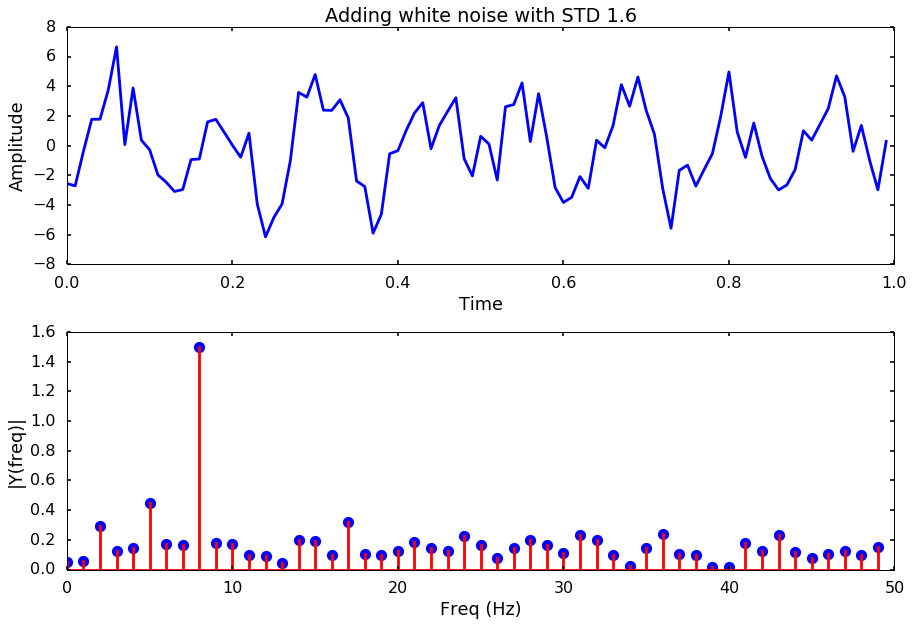
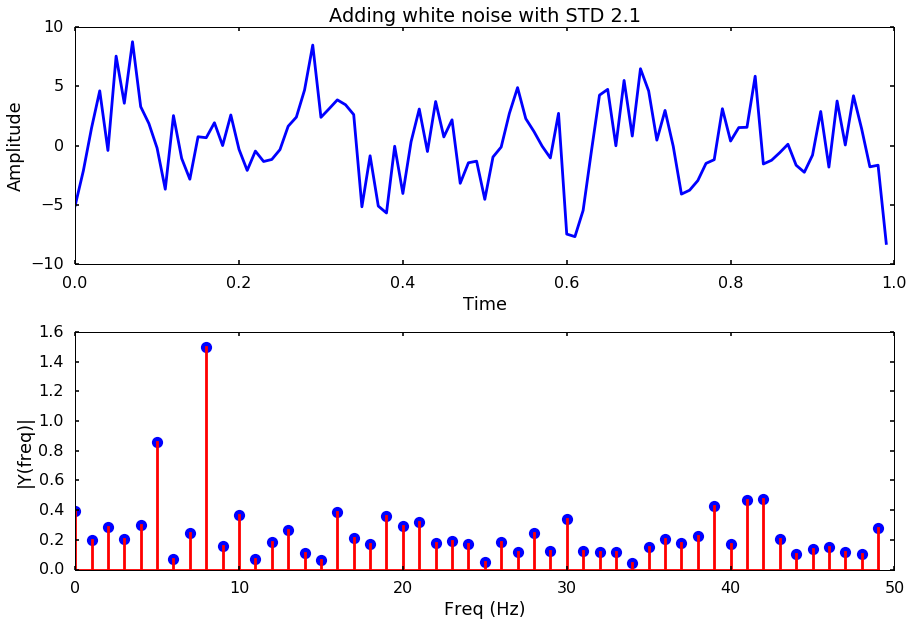
Let’s try different noise levels

for i, std_noise in enumerate(np.arange(0.1, 3, 0.5)):
    title = 'Adding white noise with STD %.1f'%std_noise
    noise = np.array([np.random.normal(scale=std_noise) for i in range(len(y))])
    y_noise = y + noise
    plotSpectrum(t, y_noise,Fs, title = title)
png
png
png
png
png
png
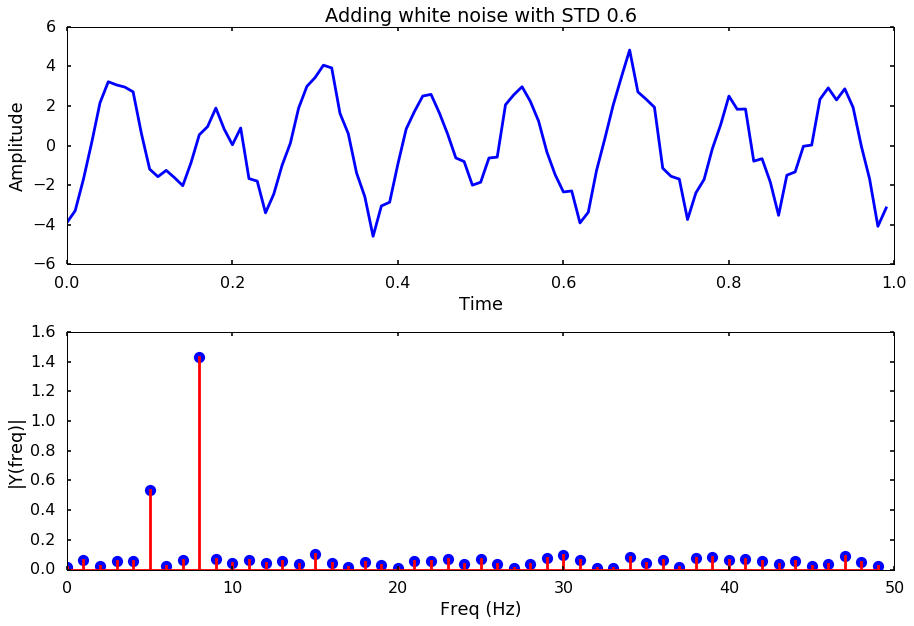
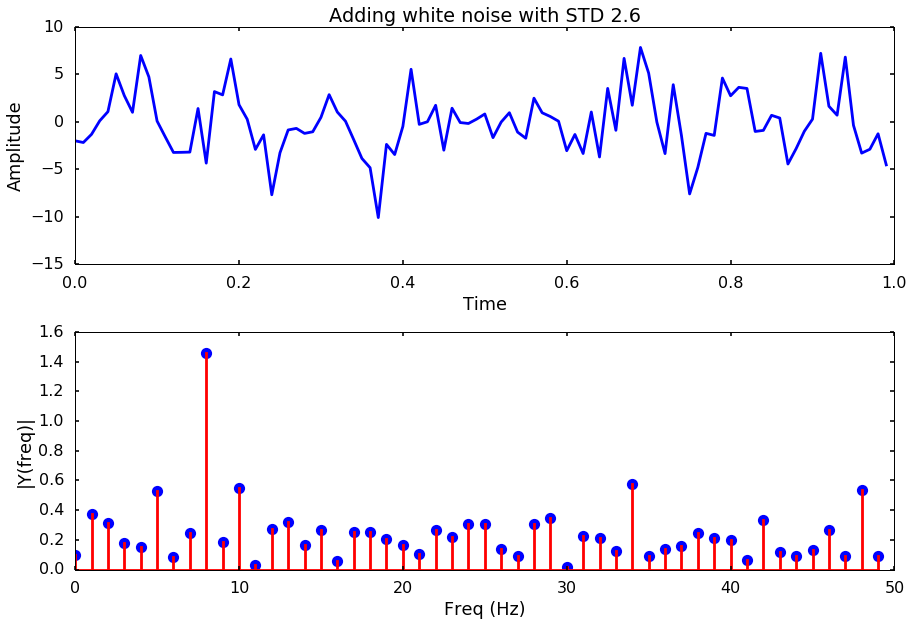
Next week, we will try to use different method to estimate the spectrum other than the simple FFT, and see if some method is better to get the frequency out even with a high-level of noise.

Sunday, October 22, 2017

Boston Visit

This week, I was traveling to Boston to give a talk at Harvard, MIT and Boston University. All these 3 universities are very nice and have different characteristics. Here are some photos I took during the visit, and hope you can see the difference between them as well. 
Harvard
jpg
jpg
jpg
jpg
jpg
jpg
jpg
jpg
jpg
jpg
jpg
jpg
Boston University
jpg
jpg
jpg
jpg
jpg
jpg
MIT
jpg
jpg
jpg
jpg
jpg
jpg
jpg
jpg
jpg
jpg
jpg
jpg
Boston Downtown

jpg

jpg

jpg

jpg
jpg

Sunday, October 1, 2017

Some nice videos I saw recently

Recently, I watched some really nice talks, and here are some of them that gave me a lot of ideas:

Andrew Ng - AI is the new electricity! 

Key messages:
Supervised learning -> Transfer learning -> Unsupervised learning -> Reinforcement learning, this is are in the order of decreasing the generated value in the industry.  Maybe the same in academia. Also, I agree that AI is the new electricity.

Ruchir Puri - Engineering the future of AI for business

Key messages:
How to learn from small data instead of big data? That is how to generalize well from a small dataset. Like a baby, he or she only sees a few pictures of dogs and cats, but then they can recognize most of the new images with different dogs and cats, there must be a way to do small data learning well!

Feifei Li - ImageNet, where have we been? Where are we going?

Key messages:

“Datasets - not algorithms - might be the key limiting factor to development of human-level artificial intelligence” - Alexander Wissner, this presentation gives a very nice history of the development of imagenet and how it started the deeplearning revolution. It advocates the importance of data, and the idea behind it is very interesting!