
Thursday, November 30, 2017
Fun: Father and Ice Cream
Recently, my daughter (3.5-year-old) draws a picture, which she calls 'Father and Ice Cream' (see the image below). I know in her eyes, both Father and Ice Cream are important. I feel the drawing of me looks like a carrot (according to one of my friend), but at least I can tell which one is me, which one is ice cream. Maybe she inherits her mom's drawing skills.
Sunday, November 19, 2017
I am on the cover of BSL Annual report
Our BSL annual report is out this week, and I am honored to be on the cover ^_^ Read our MyShake story in the report.

Saturday, November 18, 2017
Python: Grab useful data from tables on webpage
If you want to grab data from a website, where data is stored in each day (different pages). Python is really a good tool to do that for many pages instead you go through them one by one copy it. This week, one friend asked me about exactly the problem and here is how we did it. You can find all the code on Qingkai's Github.
The problem
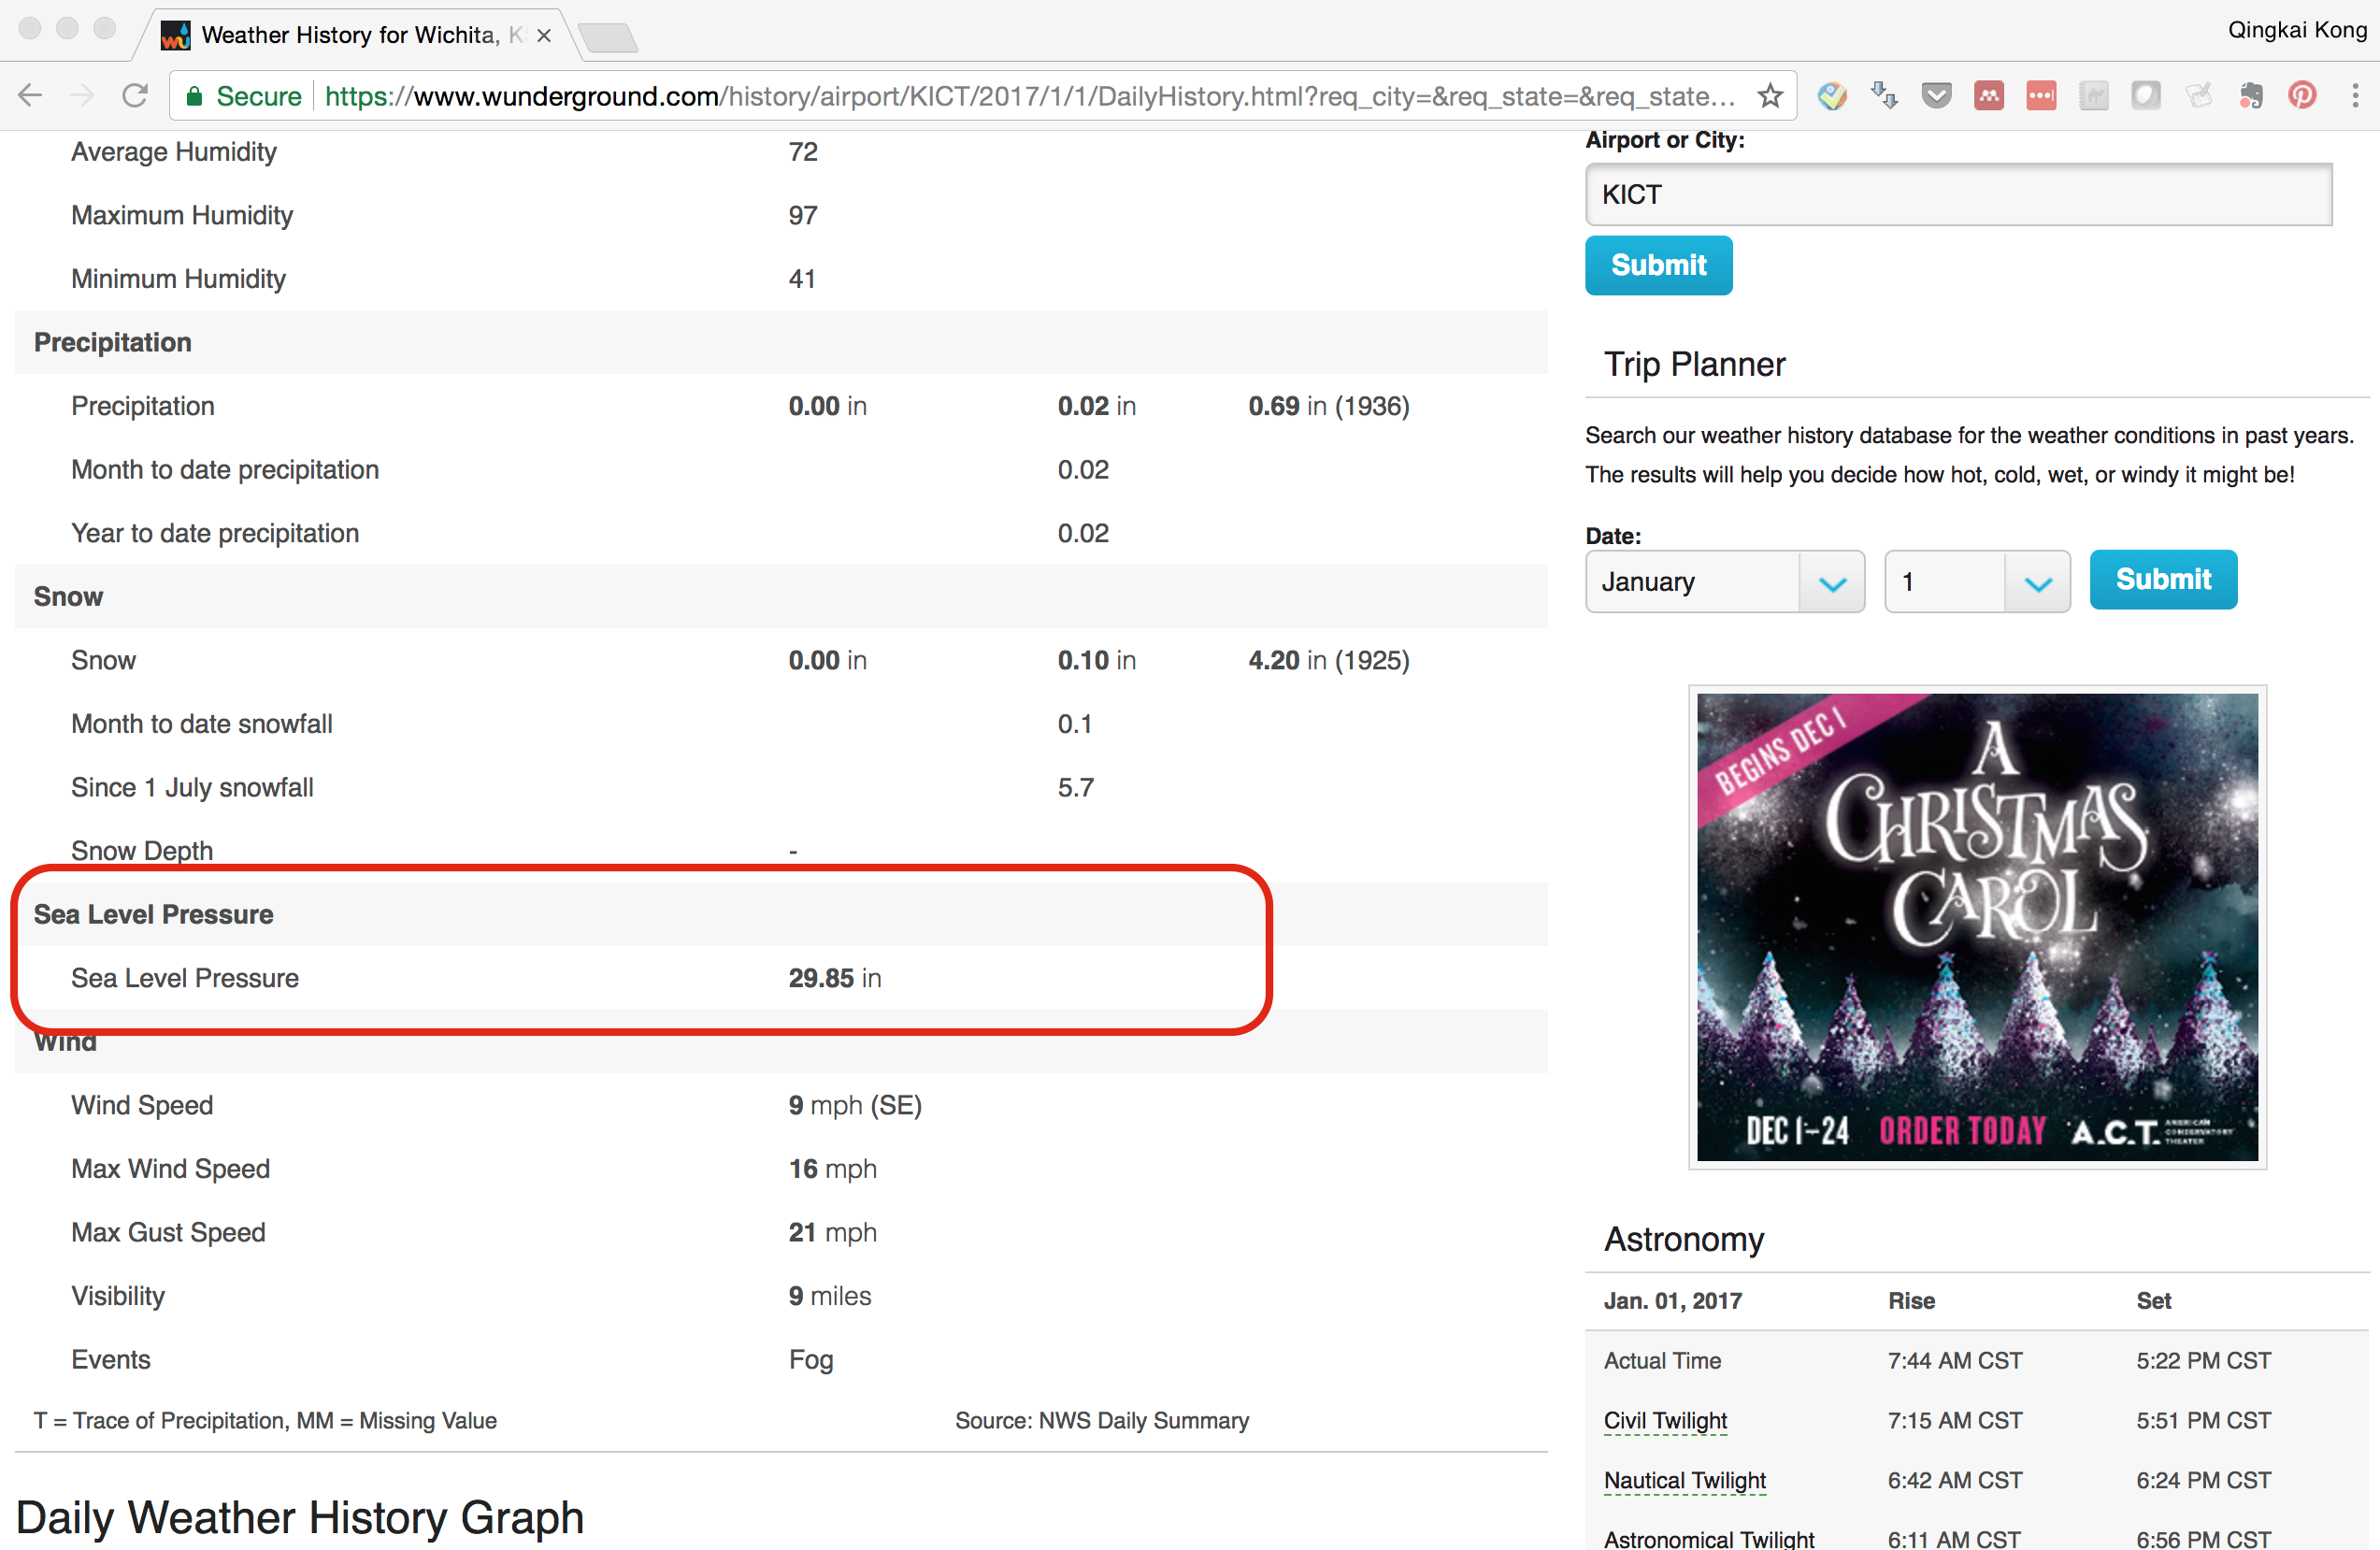
We want to download data from this website, the Sea Level Pressure value from the webpage and save it to the csv file, for example, the red part in the following figure:
Grab the value from the website
import urllib2
import datetime
import numpy as np
from BeautifulSoup import BeautifulSoup
First we will define a function that takes in year, month and day, and generate the url for the website for that day. If you look at the website url, for example: 'https://www.wunderground.com/history/airport/KICT/2017/1/1/DailyHistory.html?req_city=&req_state=&req_statename=&reqdb.zip=&reqdb.magic=&reqdb.wmo=', this website is for 2017-01-01, it is easier to think the website is like in the folders, the path to the folder is this link, if we want data from 2017-01-02, we only need to change it to 'https://www.wunderground.com/history/airport/KICT/2017/1/2/DailyHistory.html?req_city=&req_state=&req_statename=&reqdb.zip=&reqdb.magic=&reqdb.wmo='. Now you understand why we will pass the year, month, day to the function to generate the url.
def generate_url(year, month, day):
    base_url = 'https://www.wunderground.com/history/airport/KICT/%d/%d/%d/DailyHistory.html?&reqdb.zip=&reqdb.magic=&reqdb.wmo='%(year, month, day)
    return base_url
Next, we generate a list of dates from the starting date to the ending date
start = datetime.datetime.strptime("2017-01-01", "%Y-%m-%d")
end = datetime.datetime.strptime("2017-01-10", "%Y-%m-%d")
date_generated = [start + datetime.timedelta(days=x) for x in range(0, (end-start).days)]
print(date_generated)
[datetime.datetime(2017, 1, 1, 0, 0), datetime.datetime(2017, 1, 2, 0, 0), datetime.datetime(2017, 1, 3, 0, 0), datetime.datetime(2017, 1, 4, 0, 0), datetime.datetime(2017, 1, 5, 0, 0), datetime.datetime(2017, 1, 6, 0, 0), datetime.datetime(2017, 1, 7, 0, 0), datetime.datetime(2017, 1, 8, 0, 0), datetime.datetime(2017, 1, 9, 0, 0)]
Now it is the fun part, we will use the urllib module to open the url and use the BeautifulSoup module to parse the html webpage. Let’s first do this for one page: 2017-01-01.
url = 'https://www.wunderground.com/history/airport/KICT/2017/1/1/DailyHistory.html?req_city=&req_state=&req_statename=&reqdb.zip=&reqdb.magic=&reqdb.wmo='

response = urllib2.urlopen(url)
soup = BeautifulSoup(response)
The way we can extract the information is that we check the page source code - html in this case, and find the information we want. Go to the webpage, and right click on the page, and choose ‘View Page Source’. You will see the raw html for the webpage. Browse through the source page, you will see find that the data we want stored in a table, see the following figure.
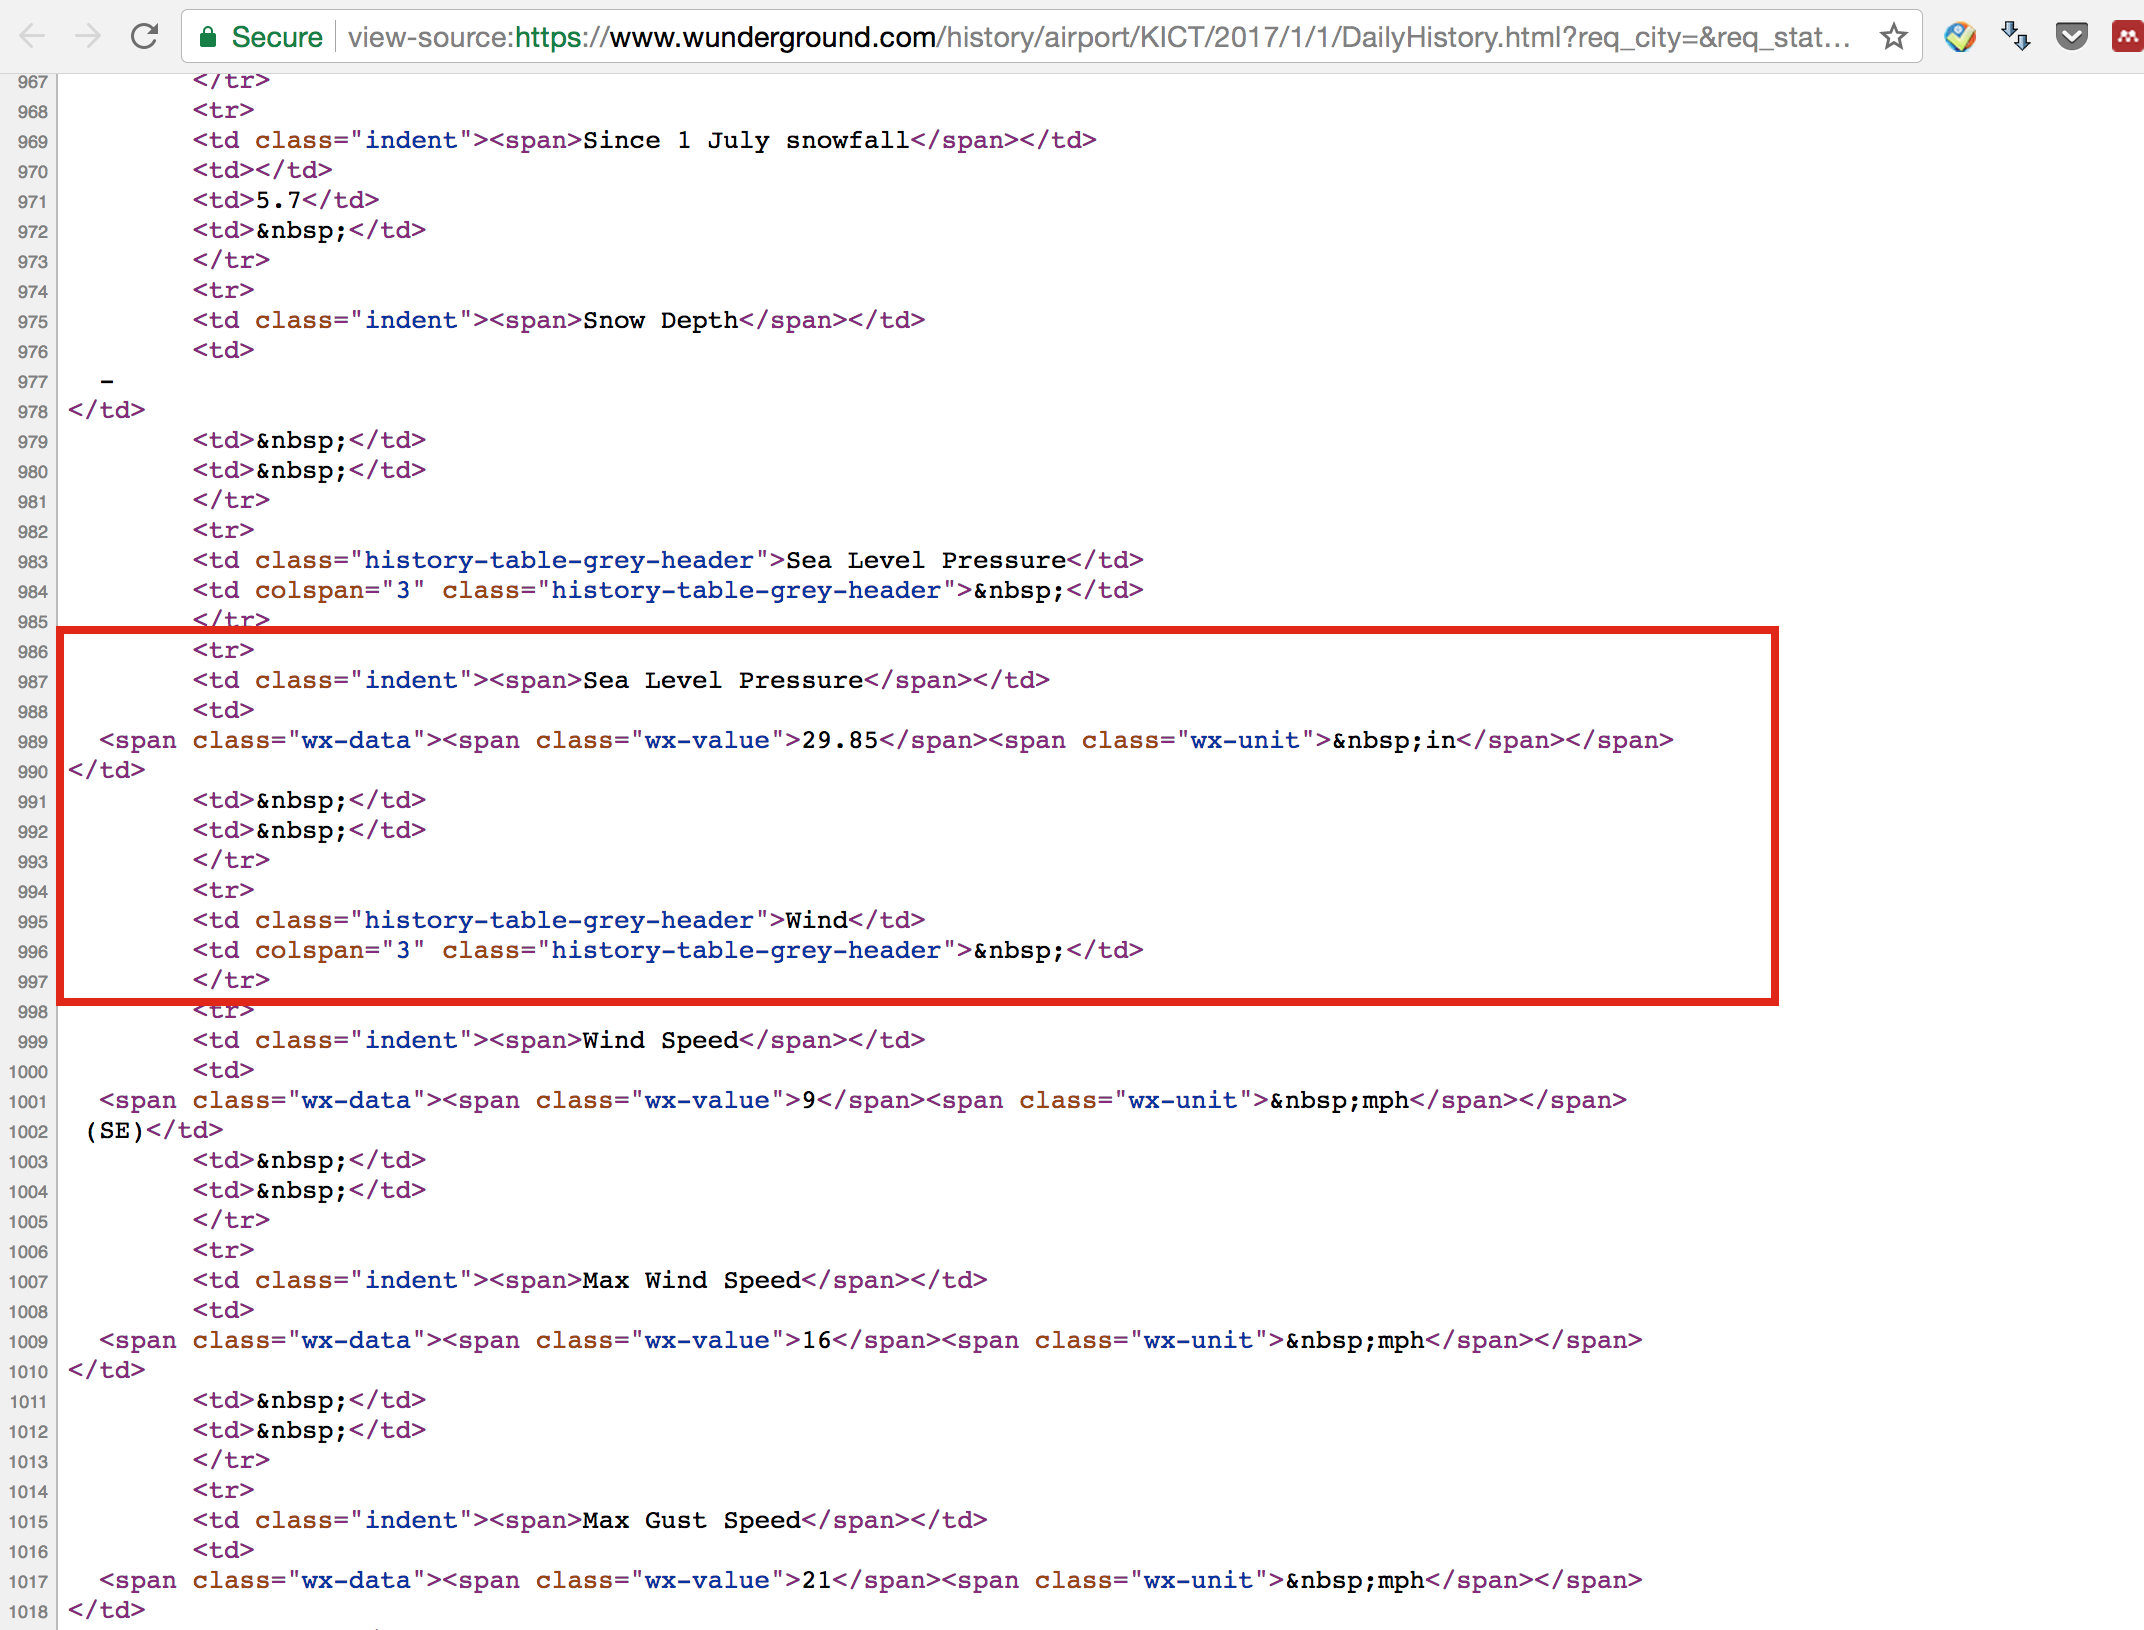
The red rectangle highlight the part we want, an HTML table is defined with the <table> tag. Each table row is defined with the <tr> tag. A table header is defined with the <th> tag. By default, table headings are bold and centered. A table data/cell is defined with the <td> tag. You can find more details here.
Now, we have an idea how the data is structured, and how we can extract it: we first find the table we want (there are multiple tables in the page). Then we find all the rows in the table, and loop through it see if it contains the 'Sea Level Pressure', if it does, we then extract the <span class> with an value "wx-value". By browsing through the html, we find the data we want stored in the table with a class 'responsive airport-history-summary-table' or id 'historyTable', which we can use this information to search.
table = soup.find('table', {'id': 'historyTable'})
You can print out the table content and see what is inside (you will see the raw html as the image shown above). We then loop through each row of this table and find the row which contains ‘Sea Level Pressure’:
# we loop through each row
for row in table.findAll('tr'):
    # find all the cells in the row
    data = row.findAll('td')

    # check if the 'Sea Level Pressure'
    if data and 'Sea Level Pressure' in data[0].text:

        if data[1].find('span'):
            pressure = data[1].find('span', attrs={'class' : 'wx-value'}).text

print pressure
29.85
The above code starts with table.findAll(‘tr’), which basically saying we want to find all the rows in this table and return them in a list. Then we loop through each row and find all the cells in the row, that is row.findAll(‘td’). The if statement checks whether the first cell in the data contains “Sea Level Pressure” as the title or not, if it does, we will find the next cell which contains a span class with ‘wx-value’ in it, that is the value we want. Also you notice that I have another if statement to check if data[1].find(‘span’), we want to see if the cell contains span or not, you will see that some of the cell contains “Sea Level Pressure” but no span (that is the title in the table).
Anyway, we successfully extract the pressure value from the table, and let’s put everything together by defining a function to return the pressure from an url, and then we can loop through all the dates.
def get_pressure(url):
    response = urllib2.urlopen(url)
    soup = BeautifulSoup(response)

    table = soup.find('table', {'id': 'historyTable'})

    for row in table.findAll('tr'):
        data = row.findAll('td')
        if data and 'Sea Level Pressure' in data[0].text:

            if data[1].find('span'):
                pressure = data[1].find('span', attrs={'class' : 'wx-value'}).text

    return pressure
results = []

for date in date_generated:
    year = date.year
    month = date.month
    day = date.day

    # generate the url for each day
    url = generate_url(year, month, day)
    date_str = date.strftime('%Y-%m-%d')
    pressure = get_pressure(url)
    results.append([date_str, float(pressure)])

print(results)
# you can also save it as csv
#np.savetxt('pressure.csv', np.array(results), fmt = '%s', delimiter=',', header='date, pressure(in)')
[['2017-01-01', 29.85], ['2017-01-02', 29.78], ['2017-01-03', 30.18], ['2017-01-04', 30.24], ['2017-01-05', 30.24], ['2017-01-06', 30.43], ['2017-01-07', 30.65], ['2017-01-08', 30.43], ['2017-01-09', 29.97]]
Get all the table values
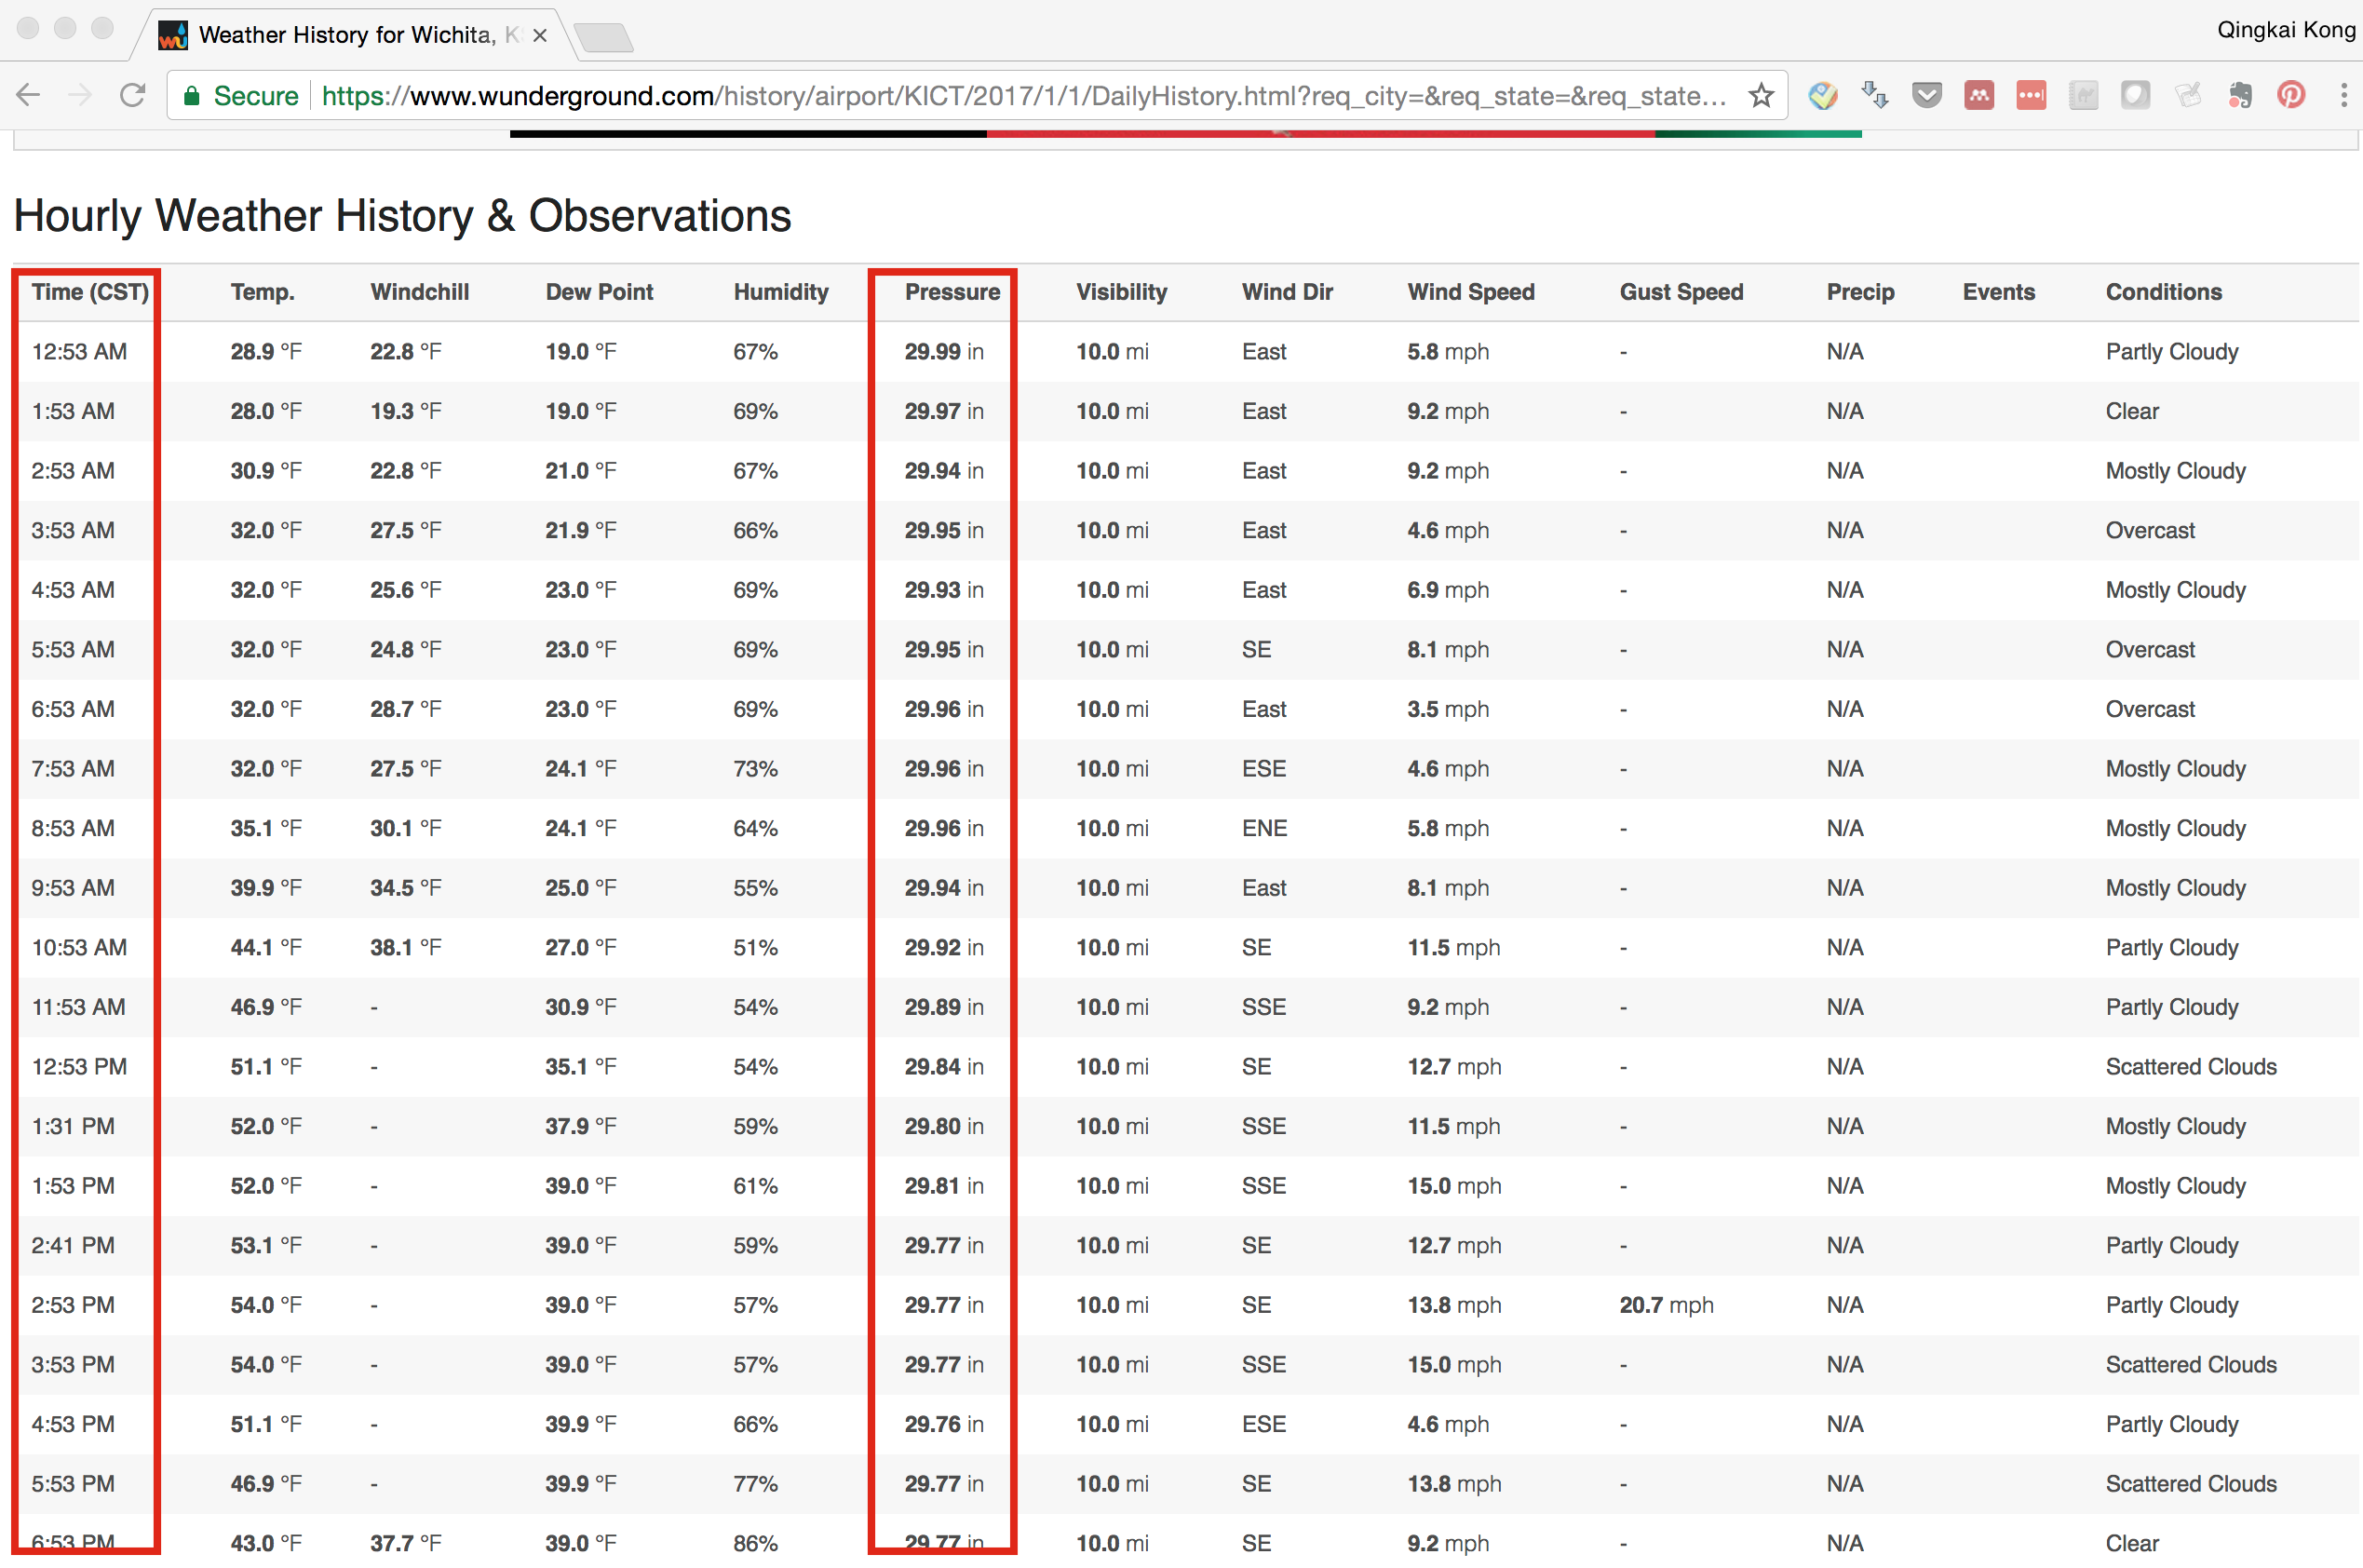
Ok, till now, I think you already knew how to extract values from a cell in a table. Let’s do another test: If you scroll down two the bottom of the page, you will see a table with about each hour measurements (see the following figure), now we want to get each day, each hour sea level pressure measurements. One example is:
I think I don’t need to explain more, see the code below, you can figure it out :-)
# To save space, let's only get two days data
start = datetime.datetime.strptime("2017-01-01", "%Y-%m-%d")
end = datetime.datetime.strptime("2017-01-03", "%Y-%m-%d")
date_generated = [start + datetime.timedelta(days=x) for x in range(0, (end-start).days)]

results = []
for date in date_generated:
    year = date.year
    month = date.month
    day = date.day

    # generate the url for each day
    url = generate_url(year, month, day)
    # keep a string for that date
    date_str = date.strftime('%Y-%m-%d')

    response = urllib2.urlopen(url)
    soup = BeautifulSoup(response)

    # by looking at the html, we found the table name is 'obs-table responsive'
    table = soup.find('table', {'class': 'obs-table responsive'})

    # loop through the table row without the first row (that is the header)
    for row in table.findAll('tr')[1:]:
        # find all the cells
        cells = row.findAll('td')

        # we can see easily the time is in the first cell, and the pressure value is in the 5th cell
        results.append([date_str, cells[0].text, cells[5].find('span', attrs={'class' : 'wx-value'}).text])

print("\n".join(' '.join(map(str,sl)) for sl in results))
#np.savetxt('pressure.csv', np.array(results), fmt = '%s', delimiter=',', header='date, time (CST), pressure (in)')
2017-01-01 12:53 AM 29.99
2017-01-01 1:53 AM 29.97
2017-01-01 2:53 AM 29.94
2017-01-01 3:53 AM 29.95
2017-01-01 4:53 AM 29.93
2017-01-01 5:53 AM 29.95
2017-01-01 6:53 AM 29.96
2017-01-01 7:53 AM 29.96
2017-01-01 8:53 AM 29.96
2017-01-01 9:53 AM 29.94
2017-01-01 10:53 AM 29.92
2017-01-01 11:53 AM 29.89
2017-01-01 12:53 PM 29.84
2017-01-01 1:31 PM 29.80
2017-01-01 1:53 PM 29.81
2017-01-01 2:41 PM 29.77
2017-01-01 2:53 PM 29.77
2017-01-01 3:53 PM 29.77
2017-01-01 4:53 PM 29.76
2017-01-01 5:53 PM 29.77
2017-01-01 6:53 PM 29.77
2017-01-01 7:53 PM 29.78
2017-01-01 8:53 PM 29.79
2017-01-01 9:13 PM 29.77
2017-01-01 9:53 PM 29.78
2017-01-01 10:00 PM 29.77
2017-01-01 10:46 PM 29.77
2017-01-01 10:53 PM 29.78
2017-01-01 11:37 PM 29.77
2017-01-01 11:53 PM 29.78
2017-01-02 12:20 AM 29.76
2017-01-02 12:53 AM 29.76
2017-01-02 1:53 AM 29.75
2017-01-02 2:53 AM 29.76
2017-01-02 3:38 AM 29.75
2017-01-02 3:53 AM 29.75
2017-01-02 4:53 AM 29.73
2017-01-02 5:32 AM 29.72
2017-01-02 5:53 AM 29.71
2017-01-02 6:18 AM 29.72
2017-01-02 6:53 AM 29.73
2017-01-02 7:53 AM 29.76
2017-01-02 8:42 AM 29.75
2017-01-02 8:53 AM 29.76
2017-01-02 9:06 AM 29.74
2017-01-02 9:43 AM 29.75
2017-01-02 9:53 AM 29.77
2017-01-02 10:51 AM 29.76
2017-01-02 10:53 AM 29.76
2017-01-02 11:16 AM 29.77
2017-01-02 11:36 AM 29.75
2017-01-02 11:53 AM 29.75
2017-01-02 12:53 PM 29.73
2017-01-02 1:53 PM 29.71
2017-01-02 2:53 PM 29.71
2017-01-02 3:26 PM 29.71
2017-01-02 3:53 PM 29.73
2017-01-02 4:53 PM 29.75
2017-01-02 5:53 PM 29.77
2017-01-02 6:51 PM 29.80
2017-01-02 6:53 PM 29.80
2017-01-02 7:08 PM 29.81
2017-01-02 7:20 PM 29.82
2017-01-02 7:29 PM 29.83
2017-01-02 7:53 PM 29.83
2017-01-02 8:11 PM 29.85
2017-01-02 8:25 PM 29.86
2017-01-02 8:53 PM 29.88
2017-01-02 9:48 PM 29.89
2017-01-02 9:53 PM 29.89
2017-01-02 10:43 PM 29.90
2017-01-02 10:53 PM 29.91
2017-01-02 11:18 PM 29.90
2017-01-02 11:53 PM 29.91Sunday, November 12, 2017
T-shirt design competition for Berkeley Seismology Lab
This week at Berkeley Seismology Lab here, we have a competition to design a lab T-shirt for the Christmas party. I decided to design one as well. The following is my design about the T-shirt.
Back

The back of the T-shirt is our Berkeley Seismology Lab logo, with our two favorite colors from UC Berkeley. This part I didn’t design, it is just a copy of our own logo.
Front (version 1)

I was thinking to have some nice figures in the front, but my design skills are not so good, therefore, I decided to just put some text on the front. ‘Questions about earthquakes’ will show what do we do, and a good conversation starter, it has a meaning that we are the experts, ask us questions.
Front (version 2)
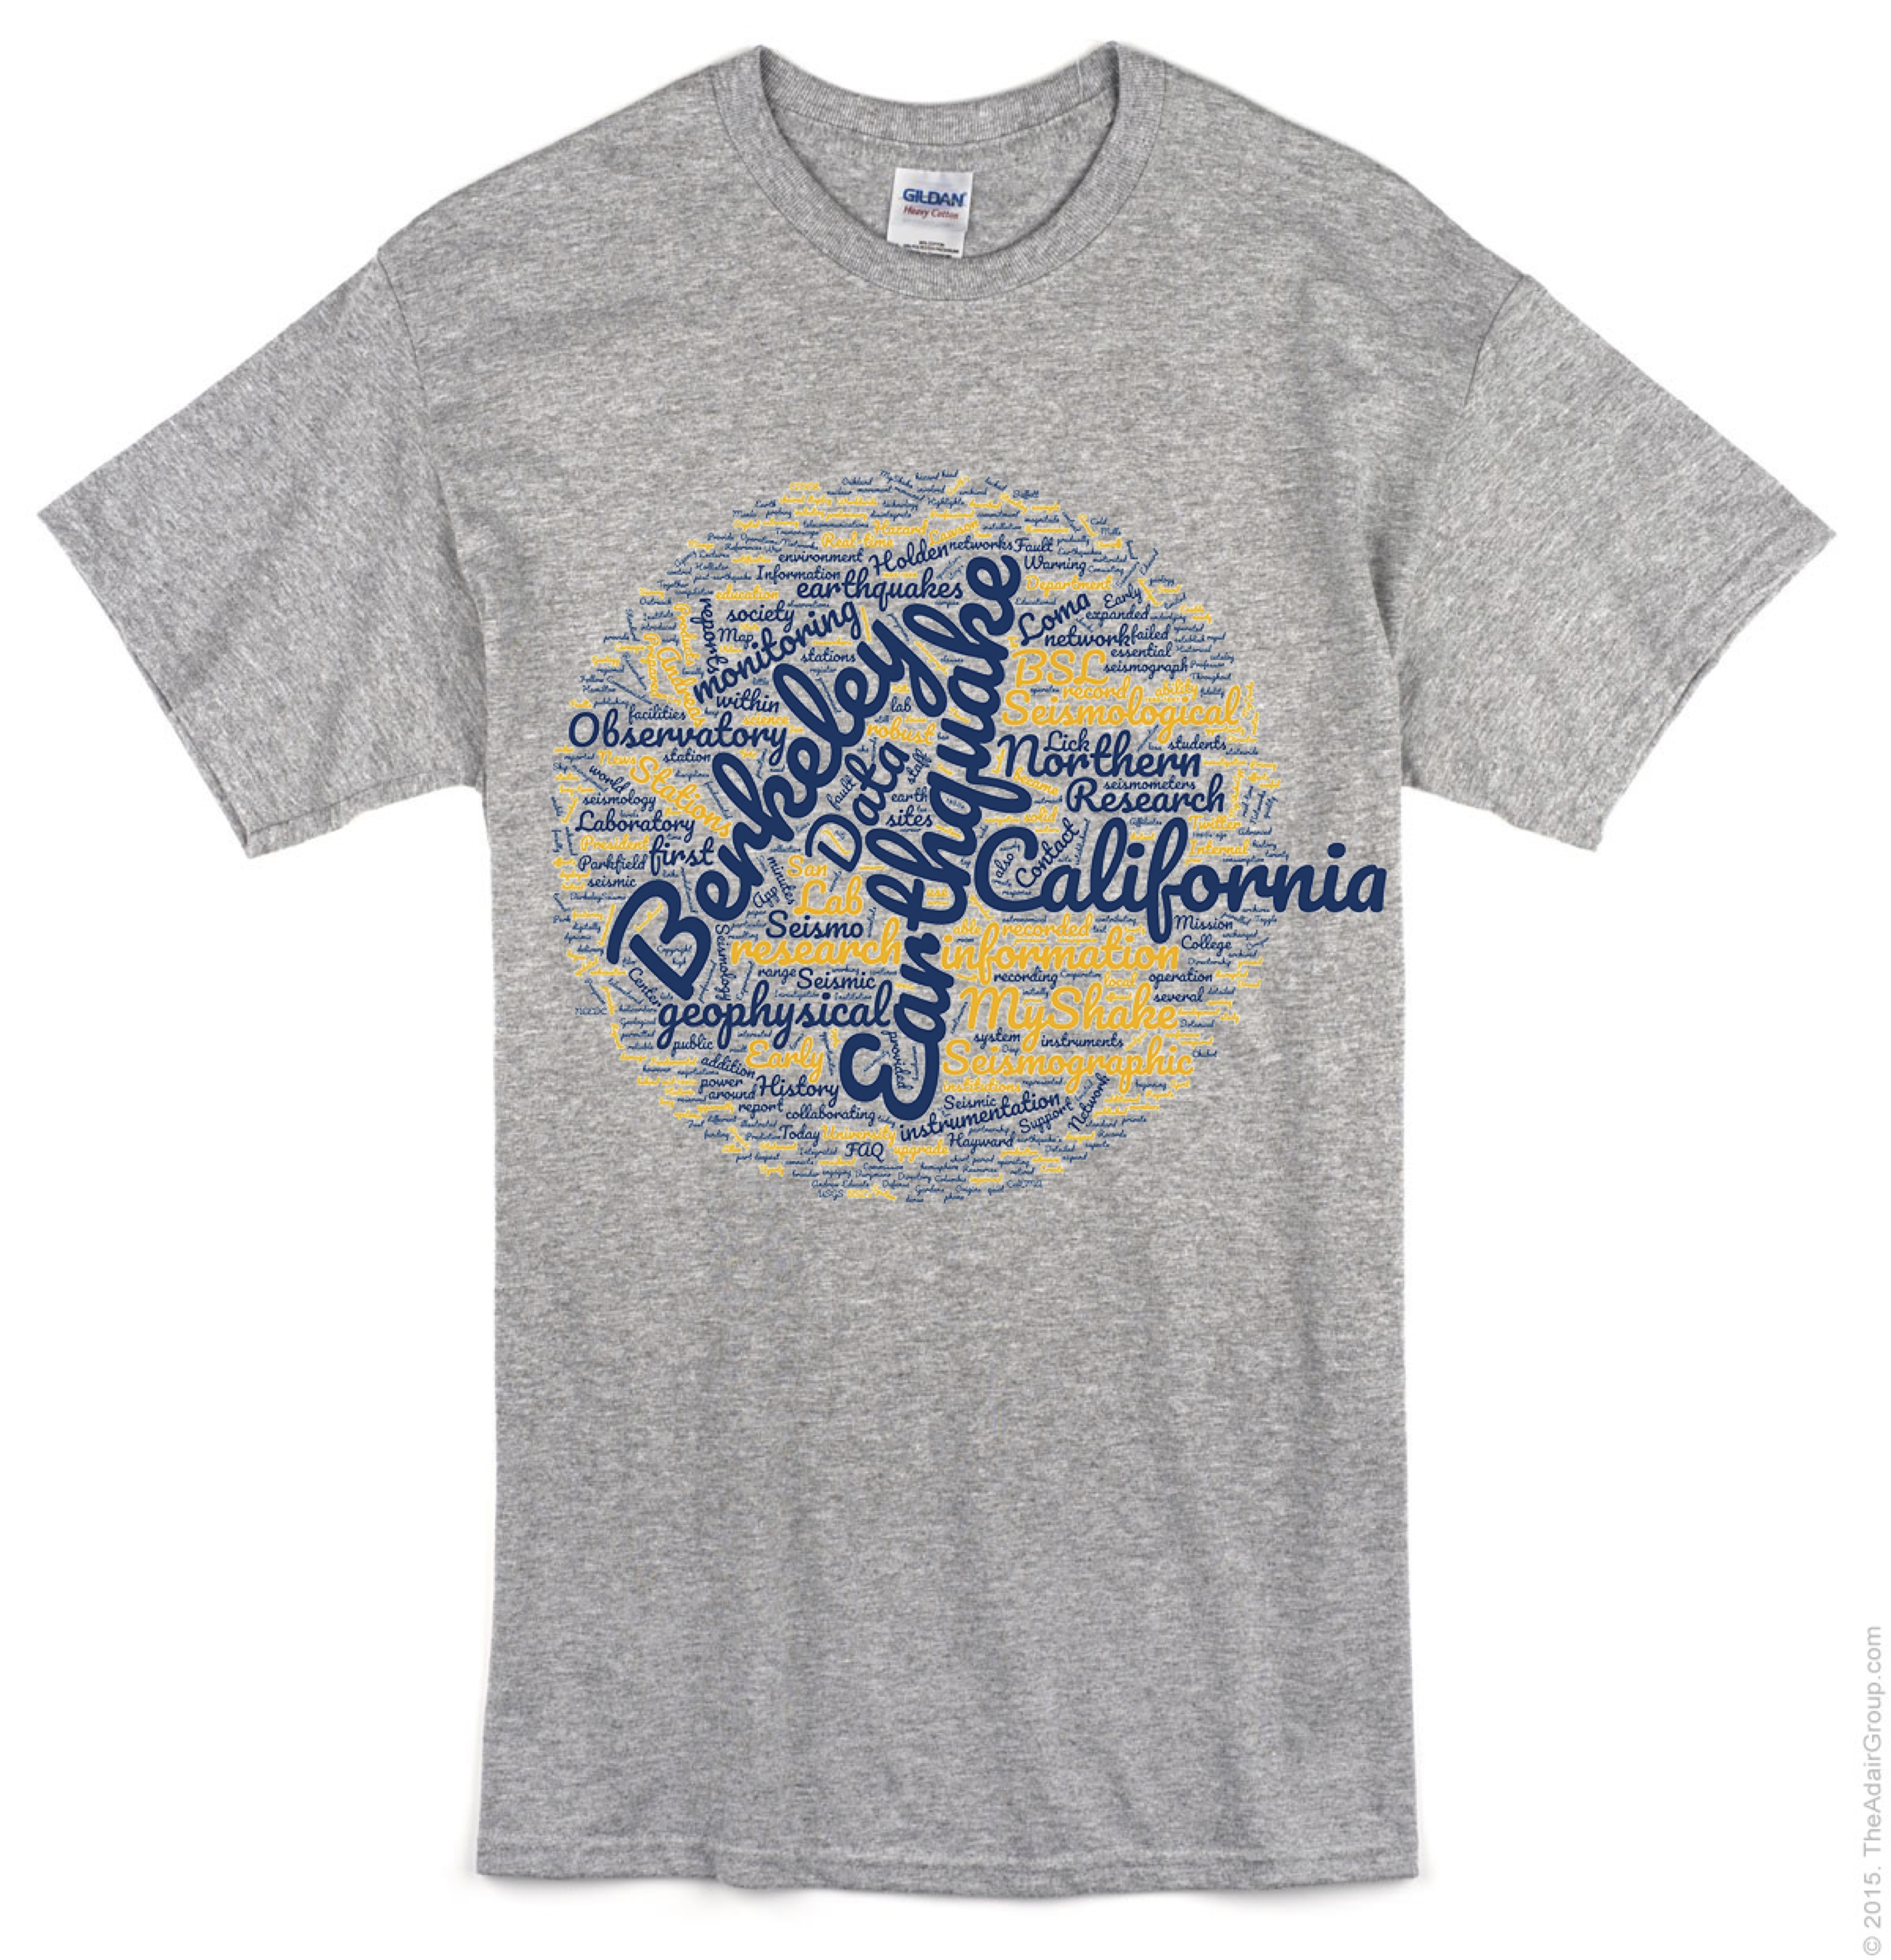
This version is a word cloud generated from our mission and history page, using the Berkeley blue and yellow, the things we do here at BSL are popped up.
Front (version 3)

This version is an equation, that we - Seismologist is made up of this 3 ingredients. And the ‘+ I + =’ part is a small face by design :-)
Friday, November 3, 2017
Mask dots in the waters
Many times, when we plot a map with a grid of dots on it, we want to mask the dots in the water. For example, when we plot some dots represent houses on the map, we may don’t want to have them in the water. There are many ways you can avoid that, but today I will show you the way I always use by using Basemap in Python. You can find the code on Qingkai's Github.
import numpy as np
from mpl_toolkits.basemap import Basemap
import matplotlib.pyplot as plt
plt.style.use('seaborn-poster')

%matplotlib inline
Define a function to plot a list of lat/lon on map
def plot_on_map(lons_1d, lats_1d, llat, ulat, llon, ulon):
    plt.figure(figsize=(10,10))
    m = Basemap(projection='merc', lon_0=-125.36929, lat_0=38.3215,
            llcrnrlon=llon,llcrnrlat=llat- 0.01,urcrnrlon=ulon,urcrnrlat=ulat + 0.01,resolution='h')
    m.drawcoastlines()
    m.drawmapboundary()

    m.drawparallels(np.arange(llat, ulat + 0.01, (ulat - llat)/2.), labels=[1,0,0,0], linewidth=0.1, fmt='%.1f')
    m.drawmeridians(np.arange(llon, ulon + 0.01, (ulon - llon)/2.), labels=[0,0,0,1], linewidth=0.1, fmt='%.1f')

    x_0, y_0 = m(lons_1d, lats_1d)
    m.plot(x_0, y_0, 'bo', markersize=10)

    m.fillcontinents()

    plt.show()
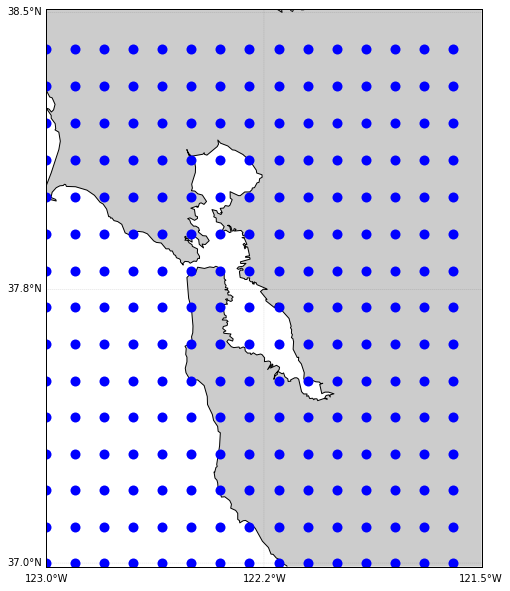
Generate a grid of data
Let’s first generate a grid of dots that cover the Bay Aera. We can see the dots we generated are evenly distributed, no matter whether it is in the water or not.
llat = 37.0
ulat = 38.5
llon = -123
ulon = -121.5

lats = np.arange(llat, ulat, 0.1)
lons = np.arange(llon, ulon, 0.1)
lons, lats = np.meshgrid(lons, lats)

# flatten the locations
lons_1d = lons.flatten()
lats_1d = lats.flatten()

plot_on_map(lons_1d, lats_1d, llat, ulat, llon, ulon)
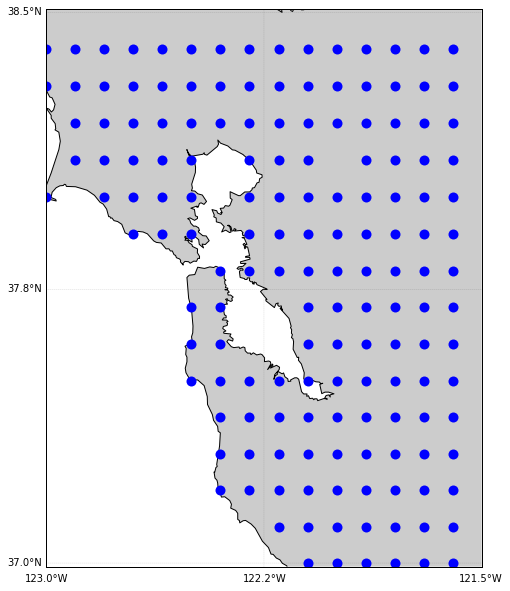
Mask the dots in water
In Basemap, there is a function called in_land for the map object can be used for our purpose. But you need to specify the resolution to be ‘f’ to get everything we need, essentially, it gets all the coastline and decides whether the dots are in water or not. Note that, you can not specify a region limit, otherwise, this function will not work. As we cannot specify a small region, it will take some time to run the following code to get the mask.
# Note this will take a while, therefore, don't run this often :-)
# get the costline and everything using 'f' as resolution, this is also requires a lot of time
m = Basemap(projection='merc', resolution='f')

x_0, y_0 = m(lons_1d, lats_1d)

# get the mask for the ocean or not
in_land = [m.is_land(x, y) for x, y in zip(x_0, y_0)]

lons_1d = lons_1d[in_land]
lats_1d = lats_1d[in_land]
Plot the data on a map
We can see all the dots in the ocean and the bay is gone now.
plot_on_map(lons_1d, lats_1d, llat, ulat, llon, ulon)
Subscribe to:
Comments (Atom)