The material is based on my workshop at Berkeley - Machine learning with scikit-learn. I convert it here so that there will be more explanation. Note that, the code is written using Python 3.6. It is better to read the slides I have first, which you can find it here. You can find the notebook on Qingkai's Github.
This week, we will talk how to use scikit-learn for unsupervised learning, we will talk one example in dimensionality reduction and one in clustering.
Unsupervised learning
Unsupervised Learning addresses a different sort of problem. Here the data has no labels, and we are interested in finding similarities between the objects in question. In a sense, you can think of unsupervised learning as a means of discovering labels from the data itself.
Unsupervised learning comprises tasks such as dimensionality reduction, clustering, and density estimation. For example, in the iris data discussed before, we can use unsupervised methods to determine combinations of the measurements which best display the structure of the data. As we'll see below, such a projection of the data can be used to visualize the four-dimensional dataset in two dimensions.
Dimensionality reduction with PCA
Principle Component Analysis (PCA) is a dimension reduction technique that can find the combinations of variables that explain the most variance. Consider the iris dataset. It cannot be visualized in a single 2D plot, as it has 4 features. We are going to extract 2 combinations of sepal and petal dimensions to visualize it:
from sklearn import datasets
import numpy as np
import matplotlib.pyplot as plt

plt.style.use('seaborn-poster')
%matplotlib inline
iris = datasets.load_iris()
X = iris.data
print("The dataset shape:", X.shape)
X, y = iris.data, iris.targetThe dataset shape: (150, 4)
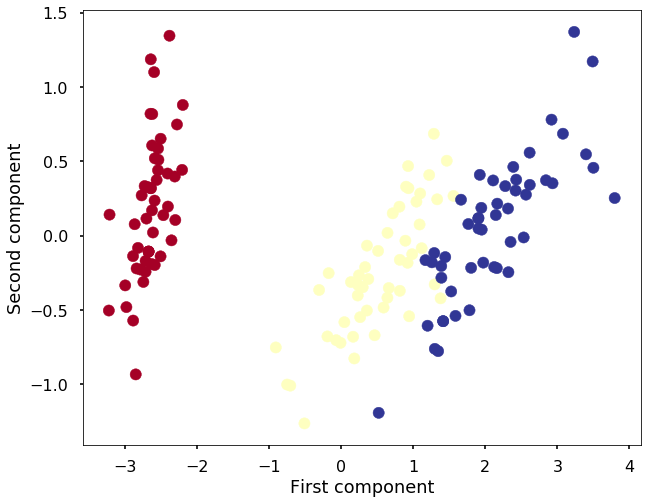
Use PCA, we can reduce the dimensions from 4 into 2 and visualize it.
from sklearn.decomposition import PCA

pca = PCA(n_components=2)
pca.fit(X)
X_reduced = pca.transform(X)
print("Reduced dataset shape:", X_reduced.shape)
Reduced dataset shape: (150, 2)plt.figure(figsize=(10,8))
plt.scatter(X_reduced[:, 0], X_reduced[:, 1], c=y, cmap='RdYlBu')
plt.xlabel('First component')
plt.ylabel('Second component')<matplotlib.text.Text at 0x1129a3cf8>
Clustering with K-means
K Means is an algorithm for unsupervised clustering: that is, finding clusters in data based on the data attributes alone (not the labels).
K Means is a relatively easy-to-understand algorithm. It searches for cluster centers which are the mean of the points within them, such that every point is closest to the cluster center it is assigned to.
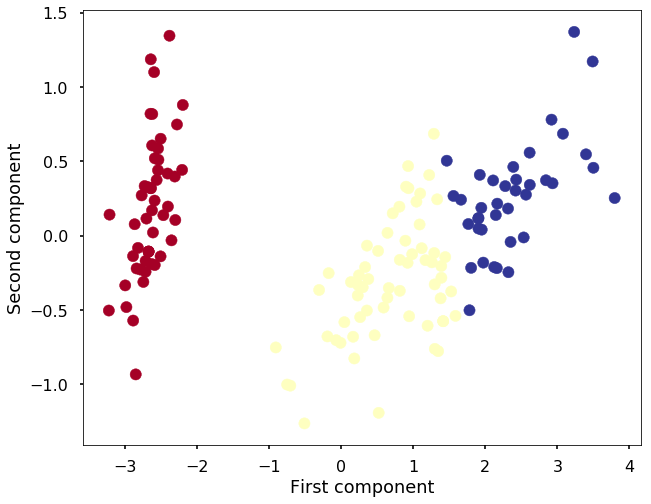
Let's look at how KMeans operates on the simple clusters we looked at previously - The Iris dataset. To emphasize that this is unsupervised, we'll not plot the colors of the clusters:
Train K-means
from sklearn.cluster import KMeansk_means = KMeans(n_clusters=3, random_state=2)
k_means.fit(X)
y_pred = k_means.predict(X)
plt.figure(figsize=(10,8))
plt.scatter(X_reduced[:, 0], X_reduced[:, 1], c=y_pred, cmap='RdYlBu')
plt.xlabel('First component')
plt.ylabel('Second component')<matplotlib.text.Text at 0x112ec65c0>
Excercise
When we use PCA, visualization is just one purpose. Sometimes, we have high dimensional data that we want to use PCA to reduce the dimensionality while keep certain amount of information in the new PCA transformed data.
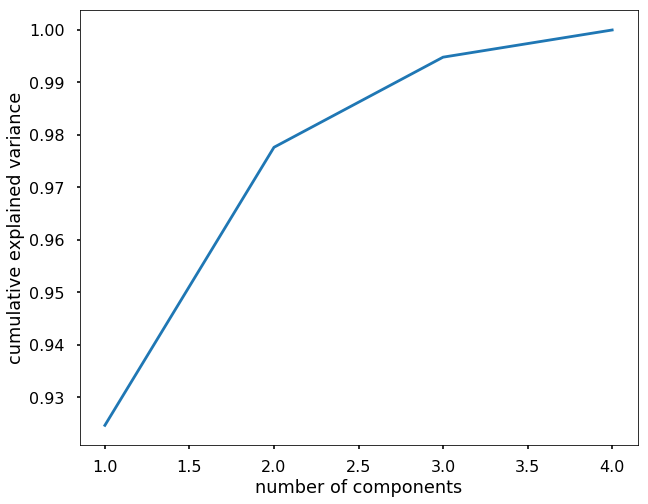
In this exercise, please use PCA on the Iris data and keep the components that explained 95% of the variance of the original data.
############################### Solution 1 #################################

# fit a PCA model
pca = PCA().fit(X)

plt.figure(figsize=(10,8))
plt.plot(range(1, X.shape[1]+1), np.cumsum(pca.explained_variance_ratio_))
plt.xlabel('number of components')
plt.ylabel('cumulative explained variance')

# we can see that with the first two components, we can explain over 95% of the variance,
# then we can train PCA with only 2 components
# fit a PCA model
pca = PCA(n_components = 2).fit(X)
X_reduced = pca.transform(X)
############################### Solution 2 #################################
## Or we can simplely use n_components = 0.95
pca = PCA(n_components = 0.95).fit(X)
X_reduced = pca.transform(X)
Good Blog
ReplyDeleteThanks For Sharing
Machine learning in Vijayawada
Internet Business Ideas for 2020
ReplyDeleteFive weeks ago my boyfriend broke up with me. It all started when i went to summer camp i was trying to contact him but it was not going through. So when I came back from camp I saw him with a young lady kissing in his bed room, I was frustrated and it gave me a sleepless night. I thought he will come back to apologies but he didn't come for almost three week i was really hurt but i thank Dr.Azuka for all he did i met Dr.Azuka during my search at the internet i decided to contact him on his email dr.azukasolutionhome@gmail.com he brought my boyfriend back to me just within 48 hours i am really happy. What’s app contact : +44 7520 636249
ReplyDeleteDR EMU WHO HELP PEOPLE IN ANY TYPE OF LOTTERY NUMBERS
ReplyDeleteIt is a very hard situation when playing the lottery and never won, or keep winning low fund not up to 100 bucks, i have been a victim of such a tough life, the biggest fund i have ever won was 100 bucks, and i have been playing lottery for almost 12 years now, things suddenly change the moment i came across a secret online, a testimony of a spell caster called dr emu, who help people in any type of lottery numbers, i was not easily convinced, but i decided to give try, now i am a proud lottery winner with the help of dr emu, i won $1,000.0000.00 and i am making this known to every one out there who have been trying all day to win the lottery, believe me this is the only way to win the lottery.
Dr Emu can also help you fix this issues
(1)Ex back.
(2)Herbal cure & Spiritual healing.
(3)You want to be promoted in your office.
(4)Pregnancy spell.
(5)Win a court case.
Contact him on email Emutemple@gmail.com
What's app +2347012841542
Website Https://emutemple.wordpress.com/
Https://web.facebook.com/Emu-Temple-104891335203341